At the urgent request of the Indonesian government institution (BRIN), the disaster-response team led by Professor Lixin Wu of Central South University, Academician of the International Eurasian Academy of Sciences, conducted rapid flood monitoring and assessment across Indonesia. The initial assessment covered November 26 to December 1, 2025 (https://gip.csu.edu.cn/info/1483/8234.html), and the follow-up assessment from December 3 to 10, 2025, aimed to track the evolving flood situation. Both assessments utilized the Disaster Response System for the Belt and Road (DRS4BR) and its Knowledge-Driven Flood Intelligent Monitoring (KDFIM) module, enabling the rapid flood detection and impact analysis.
This work incorporated multi-source satellite data, including GF-3, Sentinel-1/2, and Landsat-8/9, and combined with OpenStreetMap (OSM) building and road datasets as well as ESA WorldCover (ESA_WC). The mentioned data sources were used to comprehensively evaluate the flood impacts on infrastructure, residential buildings, and agricultural land across Indonesia. Disaster maps were produced in response to the request of BRIN for emergency satellite-based support.
The updated assessments December 3-10, 2025, applied a color-coded classification of changing flood conditions in the main maps, to distinguish the receding floods, persistent floods, and newly inundated areas, thereby providing a clear visualization of the evolving flood situation. As compared to that of Nov.26-Dec.1, 960 km length of roads are affected, with a net decrease of about 470 km, reflecting both recovery and ongoing disruptions (Fig. 1); the flooded cropland covers a total area of 1,320 km², with an increment of 30 km² about (Fig. 2); and the residential buildings affected exceeds 10,500, including approximately 3,750 newly suffered (Fig. 3).
In general, the northern coastal region remains the most severely affected area, while sub-regions labeled A through E continue to show significant localized disaster conditions, including road disruptions, widespread cropland submergence, and extensive residential inundation.
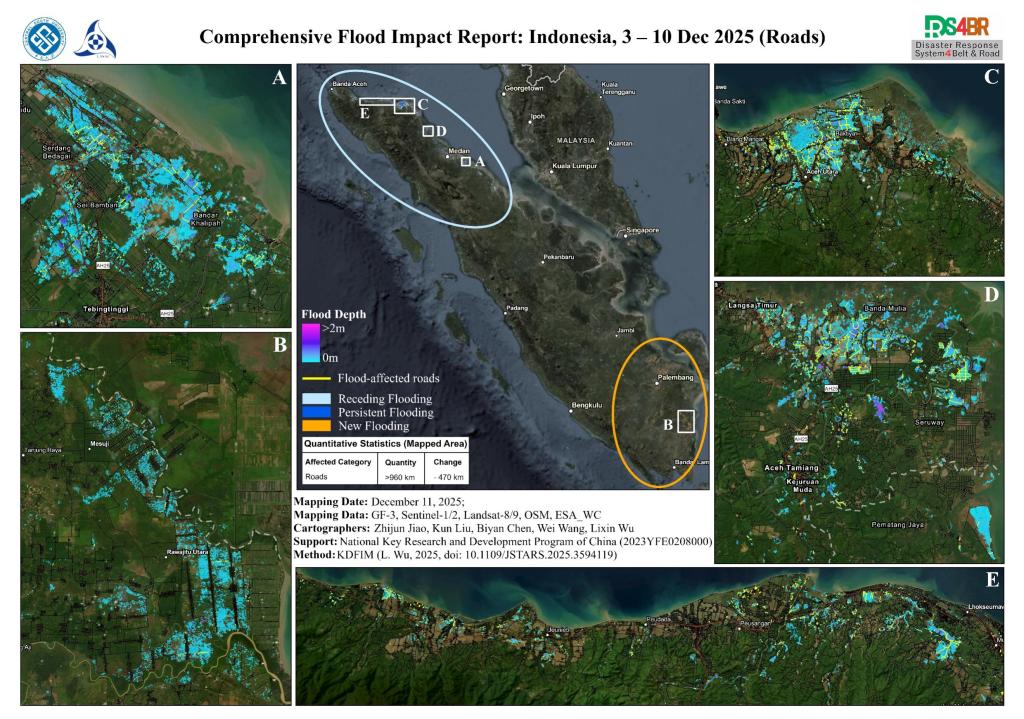
Fig. 1 Flood Impacts on Roads in Indonesia, Dec.3-10, 2025

Fig. 2 Flood Impacts on Croplands in Indonesia, Dec.3-10, 2025

Fig. 3 Flood Impacts on Buildings in Indonesia, Dec. 3-10, 2025